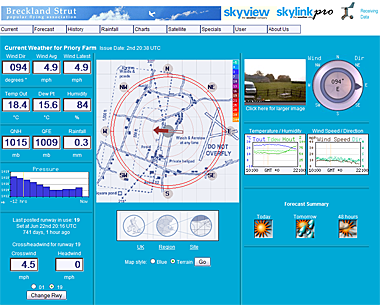
The main screen of Skylink-Pro shows your own weather data in the context of the rest of the country.
Numeric data from each sensor is shown on the left, while the middle column contains a map that can be zoomed in to region and site level. The last column has provision for your site webcam, as well as shot-span time graphs and a forecast summary.
With your site location circled in red, the centre part of the interface displays a map illustrating wind direction and wind temperature. These wind measurements are displayed with arrow symbols & a colour key. The arrows point in the predominant wind direction and the colour displays wind temperature. Yellow & red arrows indicate warmer wind currents and purples & blues indicate colder wind currents. The clickable grey tab beneath the site map gives the user the option to zoom in to the region and then into the specific site map. Mouse over any location on the map to get an instant reading of that site's weather conditions.
