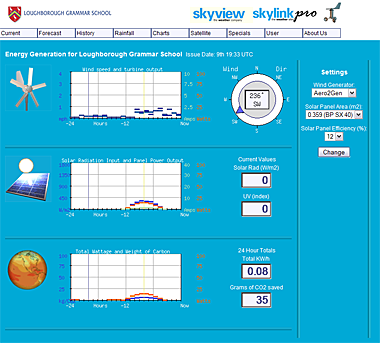
The energy page is designed primarily for schools, although it will be of use to anyone interested in knowing how much energy the current weather conditions could be producing.
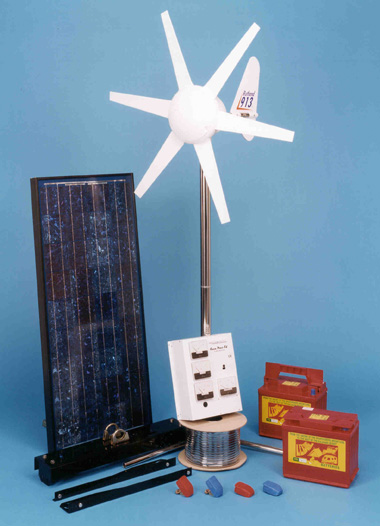
A choice of two wind generators and seven solar power panels illustrate the different power generation capabilities of commonly available equipment.
Current wind speed and solar radiation are used to calculate the power output of the selected devices, both as a continuous reading and as an accumulated daily total.
Wind Speed is shown in m/s for the period 0 to -24 hours. Turbine Output is shown in both Amps and Watts, and from the graph it can be clearly seen how steady winds under 10 m/s (less than 25 mph) produce steady and reliable outputs from the turbine.
In a similar fashion the second graph shows solar radiation in W/m2, in direct comparison to output in Amps and Watts for the last 24 hour period. As the day goes on solar radiation readings and output decrease until nightfall when the readings drop to zero.
The final graphs puts into perspective how small changes can start to make a difference by calculating for the last 24 hour period the power generated, or potentially generated, and grams of CO2 saved.
Watching these technologies in action and seeing real results from renewable weather sources is important, especially as part of an education program. Wind and Solar technologies are becoming ever more popular and will no doubt be developed in years to come to become an essential source of power for future generations. Helping students to understand and harness this technology is key to giving them the resources to shape their future.
Although this page will work with wind alone, it is of most benefit to those sites equipped with a solar radiation and UV sensor.